A dashboard-driven educational data analytics tool for better administrative decision-making
Insight Pro+
Summary
What is Tec21?
DURATION
January - August 2023
CLIENTS
Tecnológico de Monterrey
TEAM
Project Manager
Product Manager
Research Lead
UX Designer
Machine Learning Engineer
MY ROLE
Development Lead
SKILLS
Design System
Usability Testing
Literature Review
User Interviews
Speed Dating
Data Visualization
PROBLEM
A new educational model, TEC21, was launched to assist students’ competencies development, yet it still lacks the necessary methods and tools to assess its overall effectiveness.
MY FOCUS
I focused on understanding the user journey, creating and refining the design system, and validating the design through testing, particularly in the data visualization.
The Tec21 Educational Model was launched to offer personalized education in 3 stages with comprehensive competency development.
It also involves evaluating sub-competencies for each course and conducting 3 measurements at the end of each academic stage.
Exploration
Focus
Specialize
of the chosen area
on the chosen career
in the topics of your greatest interest
Research Phase
Lack of faculty availability, and diversity in role responsibilities in staff makes collaboration harder
We collectively reviewed roughly 25 pieces of academic literature on student success and the application of Predictive Models in Higher Education, conducted several expert interviews and competitive analysis (5 existing educational model and 5 products used by higher institutions) to establish an overview of the market.
EXPLORATORY RESEARCH
FINDING
Descriptive data is limited to what is currently happening and can't be used to spot future risks.
FINDING
It could take time to build up historical data for new predictive model... and the pace of getting data from different departments is also challenging
Advanced Analytics MH
Decontextualized and/or unclear data limitations can lead to harmful misuse and/or biases
LITERATURE REVIEW
We conducted a series of in-person and remote student success Interviews & workshops, Think-Aloud Sessions, and Contextual Inquiry with 14 stakeholders in Tec De Monterey to gather insight from existing tools and figure out the priorities of the problems that need to be solved, or potential opportunities for our product design.
USER-CENTERED RESEARCH
There was an incident where someone deleted all progress on a file and the data was permanently lost.
Director BP
Need a data report generation that is intuitive, transparent, contextualized, actionable, task-centered, and goal-oriented.
CONTEXTUAL INQUIRY
Significantly higher output of information from the educational effectiveness towards other teams, and a low input of feedback response in the opposite direction.
OBSERVATION
Tt’s been significantly time and effort consuming to manage and analyze this data manually in every required instanc
Team Member VC
INSIGHTS
5 key insights were established in order to identify the goals that the product design needs to target.
TEC has variables available that have already been validated by the literature. However, the main challenge is to measure success using variables that have not been tested and determine their predictive power
1#: Research-based student Success Prediction
Gathering feedback from faculty, employers, and students, involving all stakeholders in decision-making, and generating buy-in from the different stakeholders in relation to the use of data in the efforts for continuous improvement and innovation.
2#: Comprehensive stakeholder Feedback Loop
Data must be collected and presented in an actionable format to facilitate its use in cross-teams collaborations, and in context with transparency regarding its reliability and limitations so that users can avoid harmful discrimination in their decisions that impact students.
3#: Transparent and Actionable Data
Machine learning predictive algorithms would help the effectiveness team harness institutional data to automate the effectiveness assessment, risk analysis and deployment of interventions in educational resources and strategies on learning gains.
4#: Fair but Powerful Automation
A collaborative and low-threshold tool will empower team members to make sustainable and effective progress in their tasks while allowing them to easily share assets across teams.
5#: Decentralized Data Access and Analysis
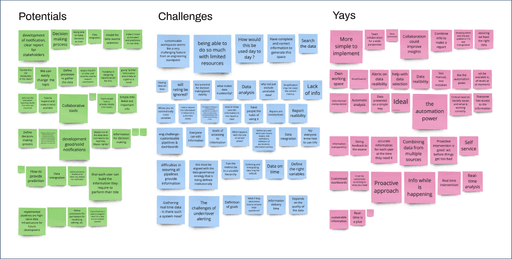
We synthesized both user-centered and exploratory research findings through an affinity diagram, ending with five concepts that would help us to obtain as much triangulation and congruence towards our insights as possible
SYNTHESIS

SYSTEM WORKFLOW
Analyze & Validate
Report & Evidence
Data & Information
Data collected
BO Platform

Decision - makers
Educational
Effectiveness Team
Partner Teams
Educational
Effectiveness Lead
Raw Data &
Processed Data
A system workflow is generated based on our field research, which assisted us to identify stakeholder’s workflow and the challenges.
USER JOURNEY MAP
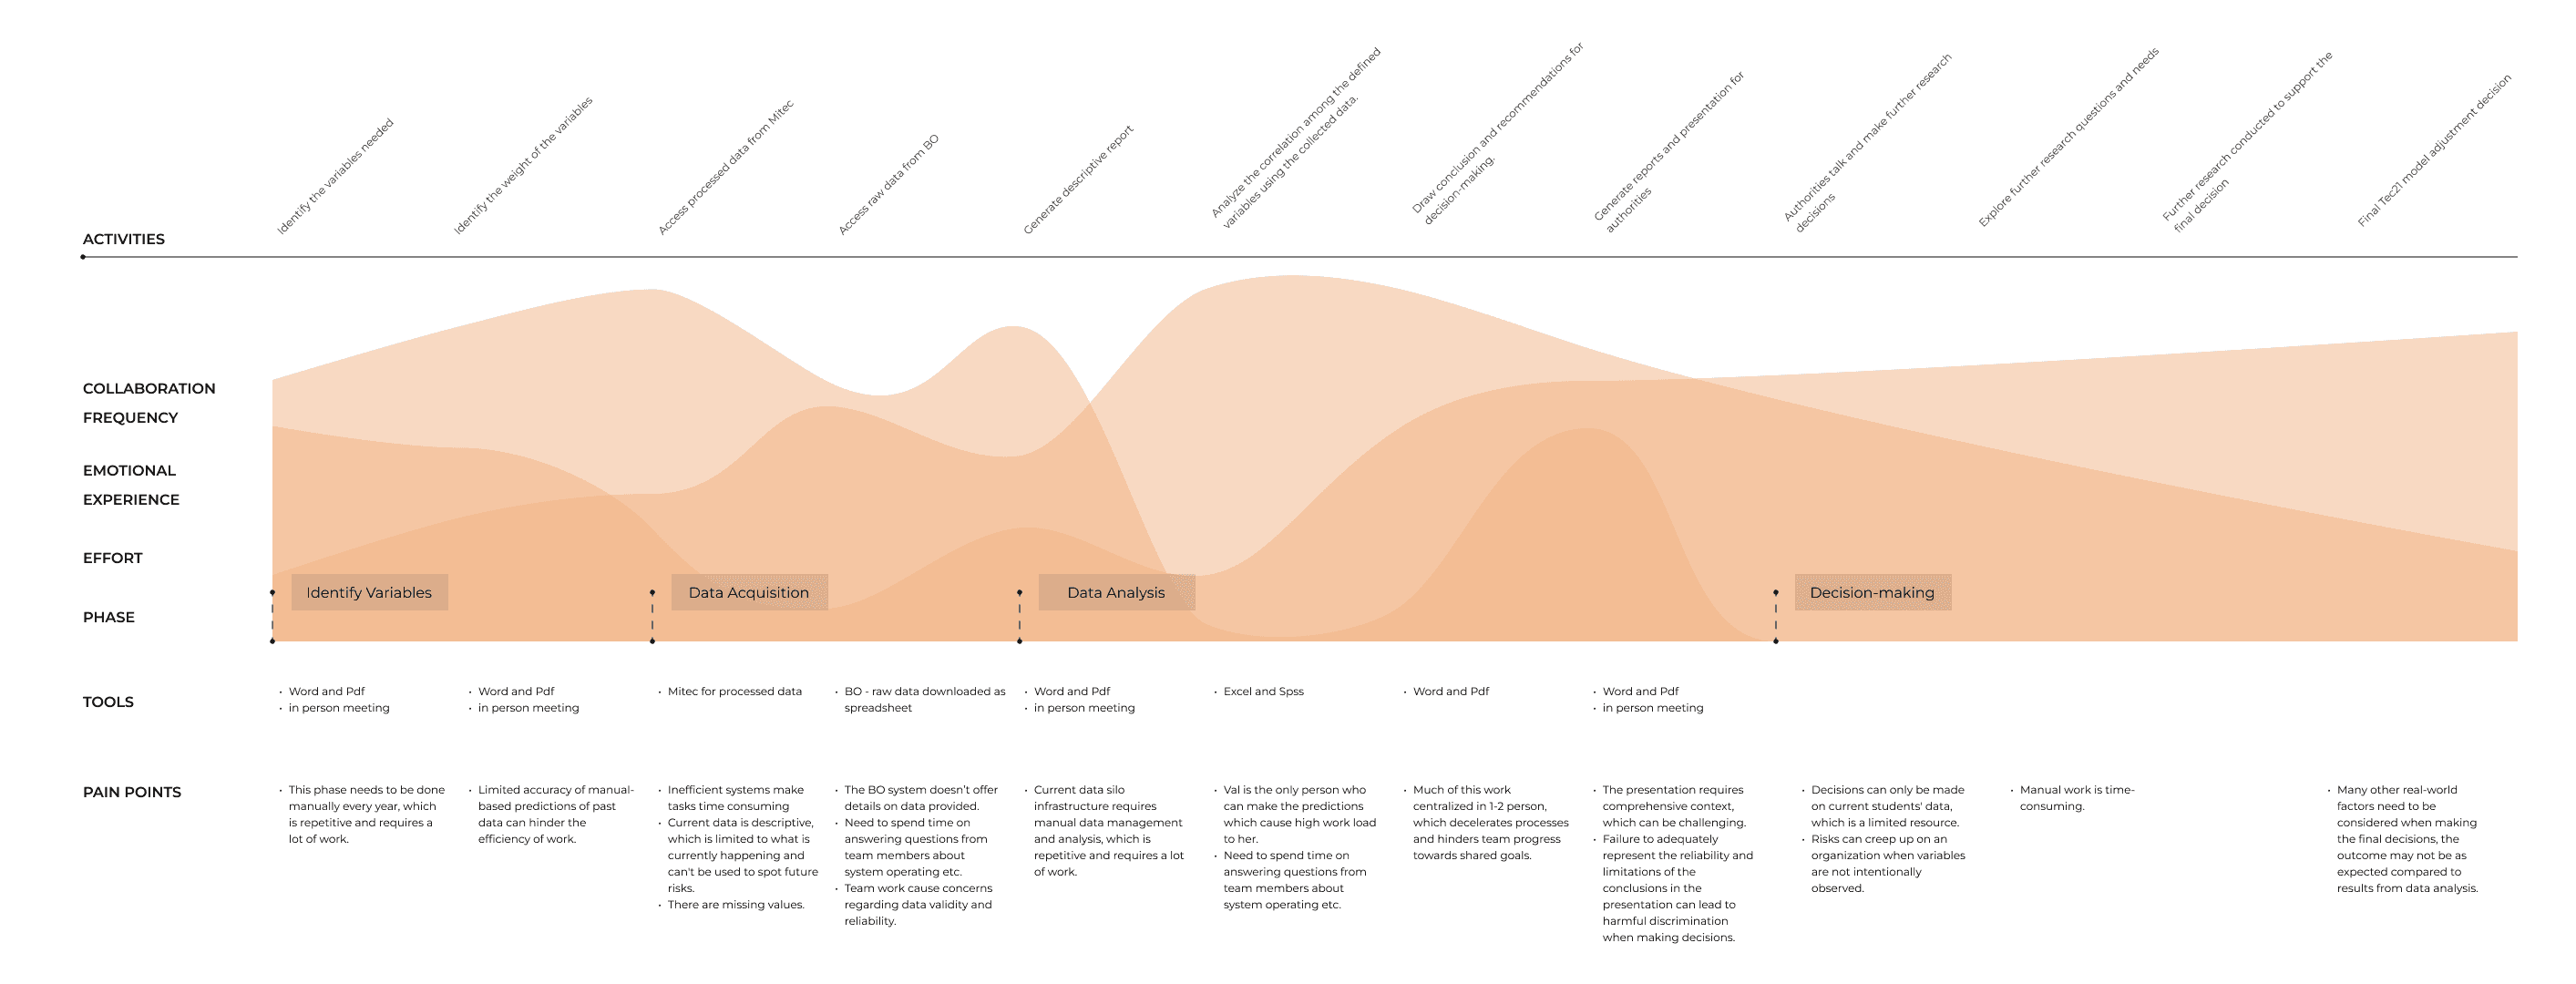
Through the contextual inquiry, we gained insights into the holistic workflow and collaboration between key stakeholders for the educational efficiency analysis project, which was represented as a user journey map
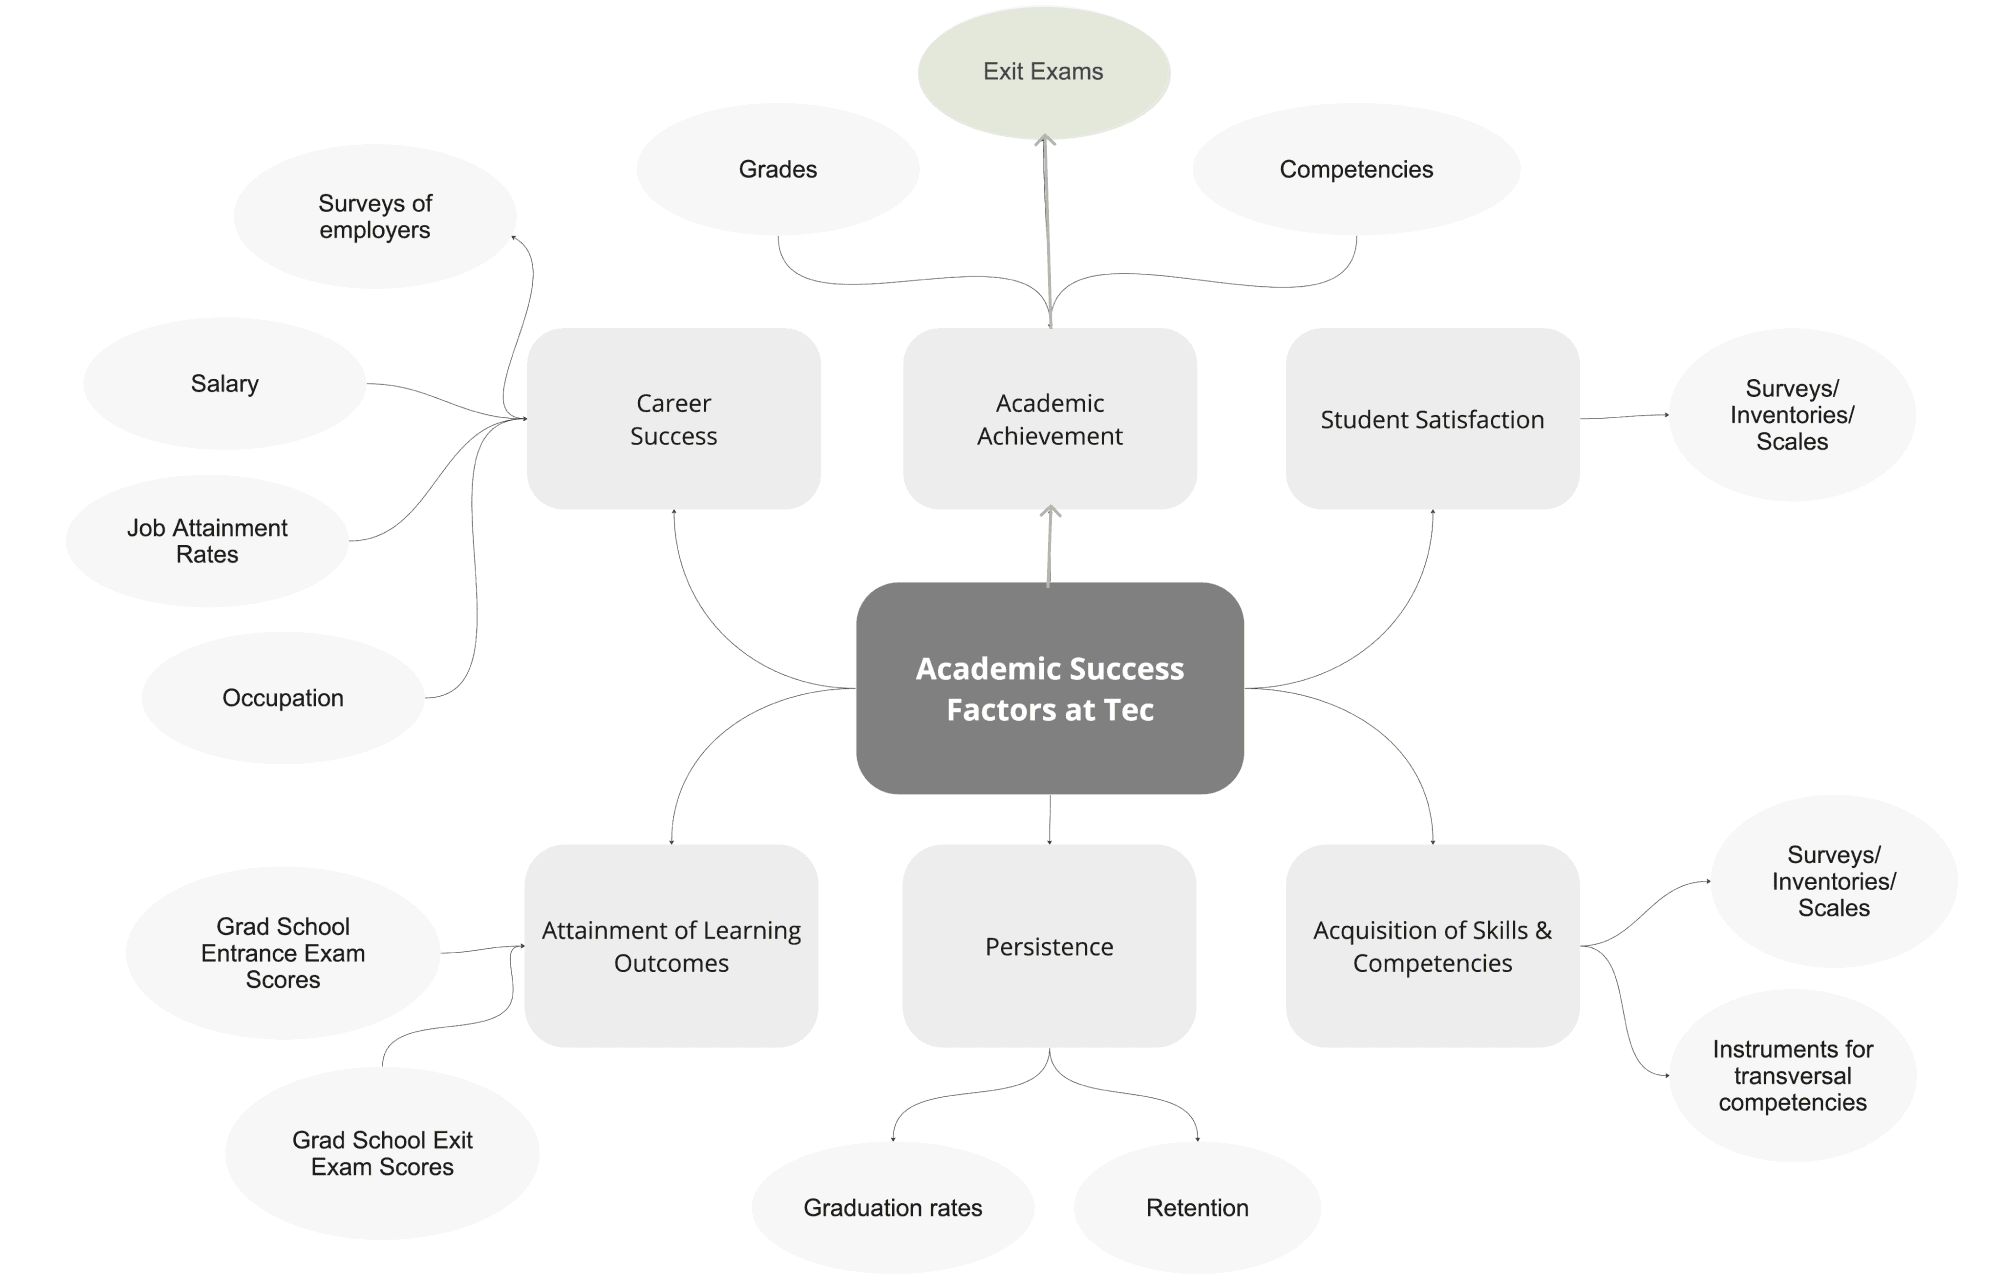
However, due to the limited data access, we discussed with our client and decided to use exit exam score as our academic success metric for the predictive model development.
IDEATION
To increase the breadth of our design ideas, we conducted crazy 8s to brainstorm as many design ideas as possible, and finalized to the following storyboards:
In our speed dating sessions, we presented each storyboard to 8 members from Tec de Monterrey who are identified as either primary users or secondary users. We synthesized the most voted sessions by consolidating notes, and we also drafted the information architecture based on the result.
In our research stage, we built a consensus around Student Success Factors at Tec de Monterrey by data collection and literature review, which would allow us to build a model and tool that is context-specific, relevant, and valuable to our client.
HYPOTHESIS 1#
HYPOTHESIS 2#
HYPOTHESIS 3#
SCOPE
After defining the problem our project will address, we developed hypotheses to narrow down the scope and indicate design direction.
We believe that by providing descriptive and predictive analysis features for Ed effectiveness team, partners, and authorities, we will achieve automated data-powered insights.
We will know this to be true when we see more team members involved in the data analysis process, a decrease in data-based decision making time and in data analysis time which can be measured by indicators in educational effectiveness team users’ satisfaction surveys. We may also see a change in the entire project workflow as data analysis becomes automated instead of manual.
We believe that by presenting data in a transparent and actionable format, the Ed effectiveness team will achieve an easier and deeper understanding of ed performance and get more buy-in from decision makers.
We will know this to be true when we see an increase in data-driven decisions and a decrease in intuition-based decisions. We can calculate the adoption rate of the proposed changes to the education model provided by the educational effectiveness team, and compare it to previous years, and consideration was given to whether other real-world factors influenced adoption or not.
We believe that by facilitating the feedback loop between stakeholders for educational effectiveness team, partners, and authorities, we will achieve data reliability, workflow efficiency, and trust between stakeholders.
We will know this to be true when we see high indicators in user satisfaction surveys.
Reality Check!
PROTOTYPING
REPORT GENERATOR ITERATIONS
We identified 3 different flows that each represents a distinct feature of our product: Automated Reporting, Predictive Analytics, and Report Collaboration. Then we sketched ideas in parallel with individual focus, and discussed and combined flows for each of our 5 iterations.
The user testing sessions were conducted using a variety of methods with 10 participants from inside and outside of Tec and 6 professionals from a variety of backgrounds. This allowed us to tend to the needs of our primary users while also incorporating different professional expertise into our product.
Users are empowered to create their reports via a drag-and-drop interface.
We gained valuable insights that highlighted the importance of providing onboarding instructions to aid users in quickly familiarizing themselves with the various features integrated into the module. So we added and refined our instructional design based on the user testing session with people with educational technology background.
ANALYSIS DASHBOARD ITERATIONS
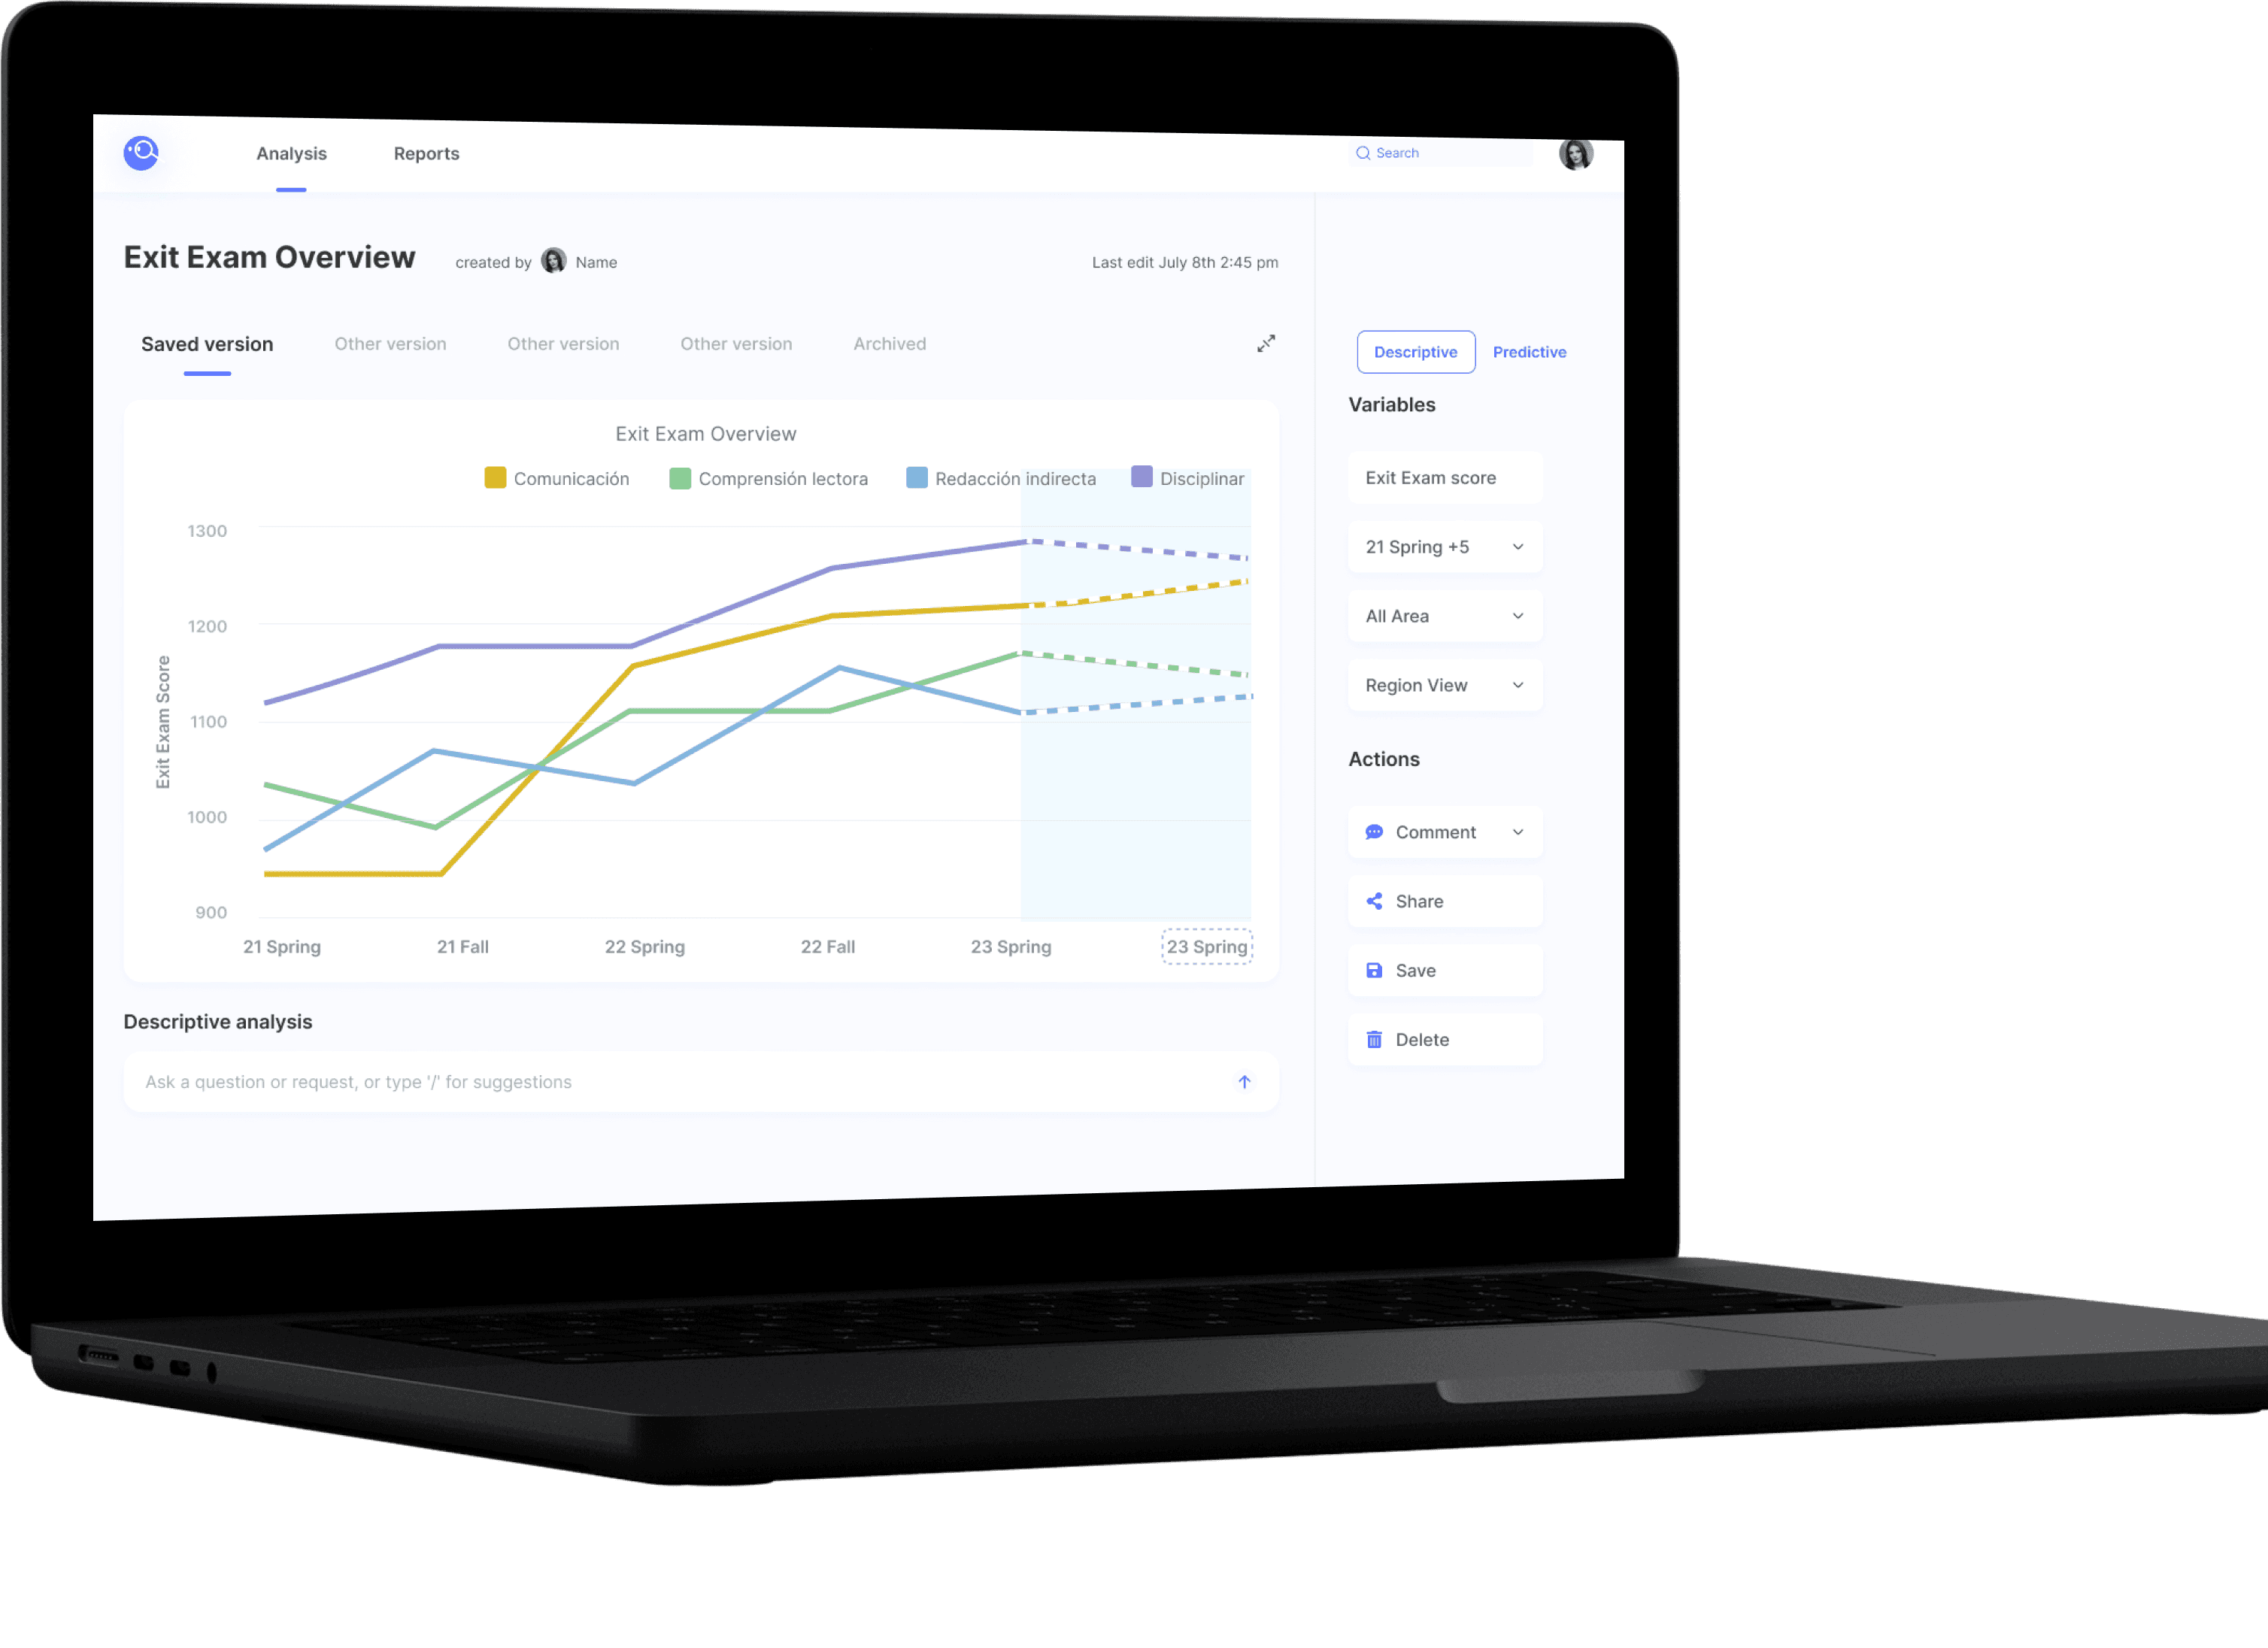
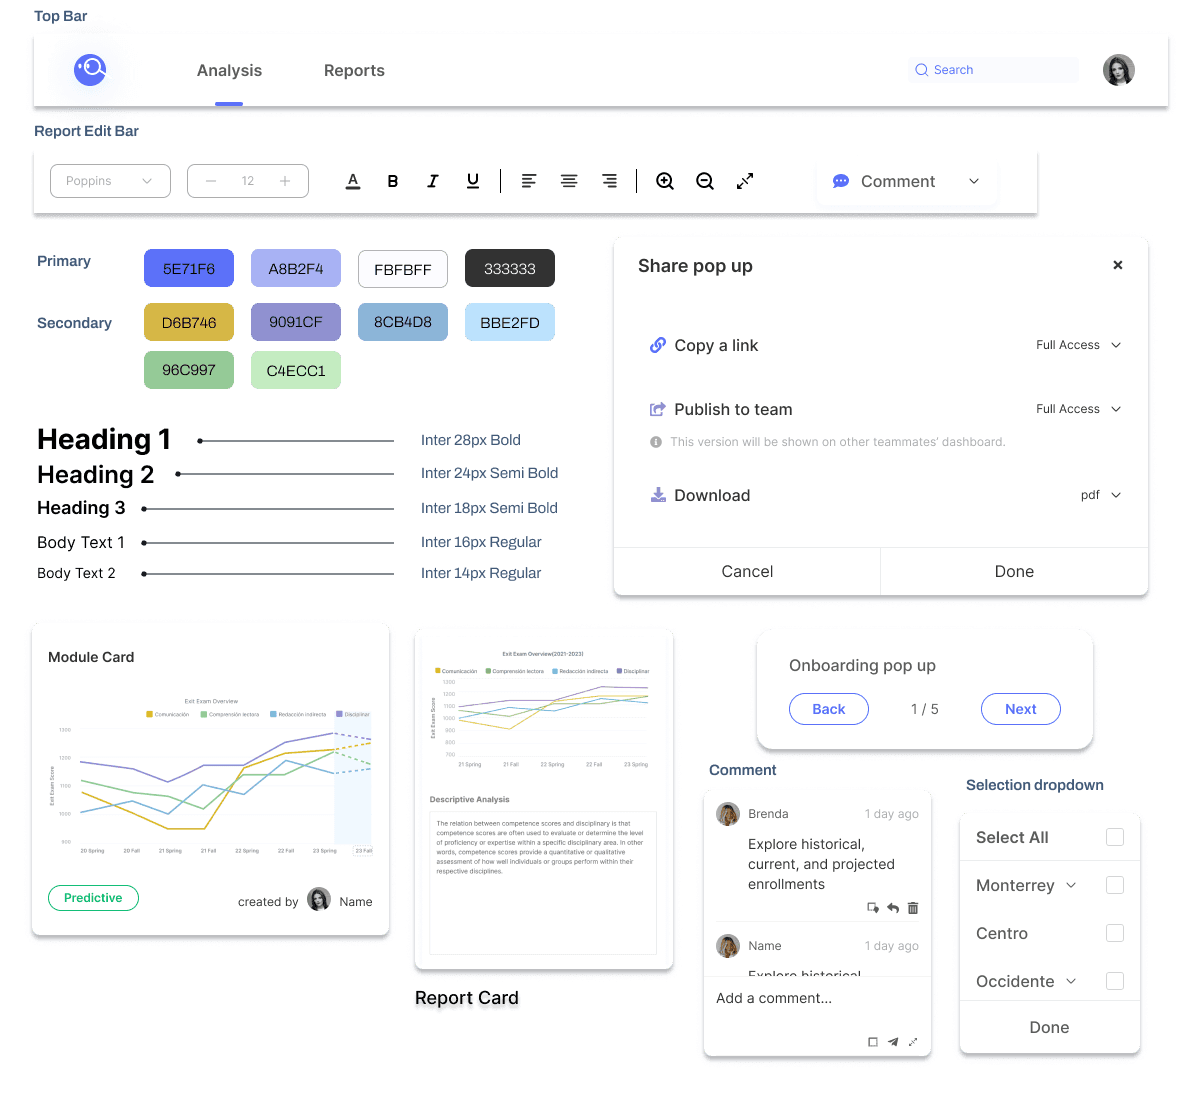
An intuitive dashboard illustrates both predictive and descriptive data in a visually engaging and interactive format. We enhanced the content recognition to facilitate intuitive navigation from graphs to the related variables, and ensuring consistency of the color theme throughout the interface.
DESIGN SYSTEM
SOLUTION
What is Insight Pro+?
Dashboard Exploration
Insight Pro+ is a report generator that automatically produces descriptive and predictive data visualizations, supporting actionable recommendations.
It will support administrative decision-making and improves the efficacy of the TEC 21 educational model at the Instituto Tecnologico de Monterrey by empowering the learning analytics approaches to identify predictive student success factors from institutional data.
User will find a selection of preset modules thoughtfully designed with specific variables to facilitate both descriptive and predictive analysis in the Module Templates.
The variable section allows users to fine-tune the variable to their preferences, and the result will be displayed in the interactive visualization section.
The predictions result would help in early identification of potential issues and proactive decision making.
Module Customization
Users can also create their own module using their local data
Collaborative Environment
The Actions section provides a range of options to assist the collaboration of report generation.
Report Generation
Users can customize the arrangement of the saved modules as well as collaborating with their teammates in this all-in-one platform.
The generative AI would promptly process the information to draft a summary based on the existing analysis.
Predictive Model
We performed Exploratory Data Analysis to clean our dataset with an insignificant data reduction of 0.16%
Our developer created and tested the predictive model for the exit exam score by predicting individual student scores and then calculating the average for each campus.
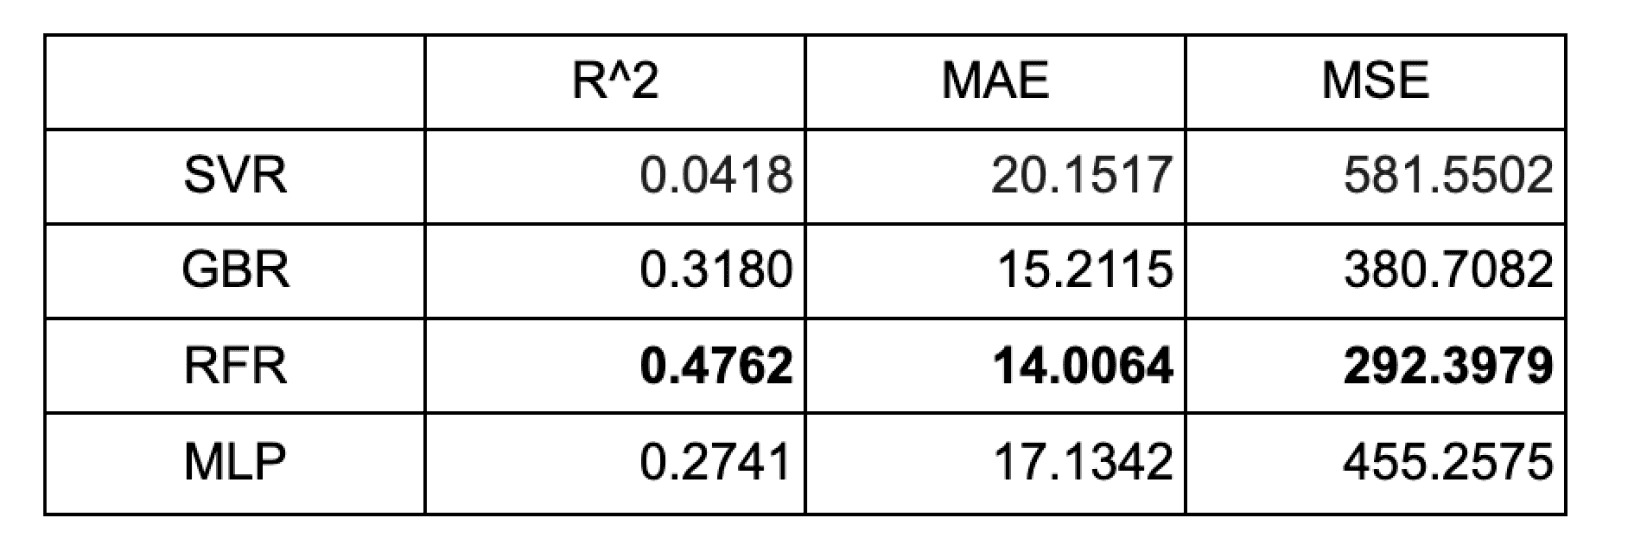
According to the statistical evaluation metrics shown on the right, the Random Forest Regressor model outperformed other models, and the prediction errors are quite low, with most falling within a remarkably narrow range of ±1.5%.
EVALUATION
At the conclusion of our project, we also revisited these Hypotheses by interviewing our primary users to evaluate how well the product meets their needs. Here are the evidence from interview data to validate our Hypotheses.
I think it [the new product] will be different in the period of time of analysis because we have to do these manually and this will save us time and help us to make a presentation because the presentation takes us time also. … I think it is good because of the time and how effective it gives us information and how analysis can be done quickly.
“
”
I think all the graphs and functions are very clear and easy to understand to anyone because it has all the tutorials and is very user friendly
“
”
Yeah, as long as I put more information to the platform. That is the thing that I’m trying to do, to force every single department to upload into the BO and everything. As much as info as I have is as much info I will be communicating.
“
”
We collected quantitative data using the Systems Usability Scale (SUS) for each iteration of the prototype. For the final high fidelity prototype, our users rated our product with an average rating of 91.7 indicating excellent usability of InsightPro+.
REFLECTION
Throughout this journey, I couldn't be prouder of the incredible achievements and growth we have experienced as a team. I sometimes felt overwhelmed with the amount of work entrusted to me, but I learned three overarching lessons:
Own up to my weaknesses when I can't complete things by myself, and don't hesitate to ask for help.
LESSON 1
We're here to explore and expand, so stay creative and utilize all the resources we have
LESSON 2
Creating quick prototypes and mockups could gather feedback early in the design process, saving time and resources
LESSON 3
Other Projects

Mind Mate
A web platform fosters online social well-being
Coming Soon
More works on the way :)
© 2023 By Zoey Ye


